App analytics
Access analytics to see how your app performs.
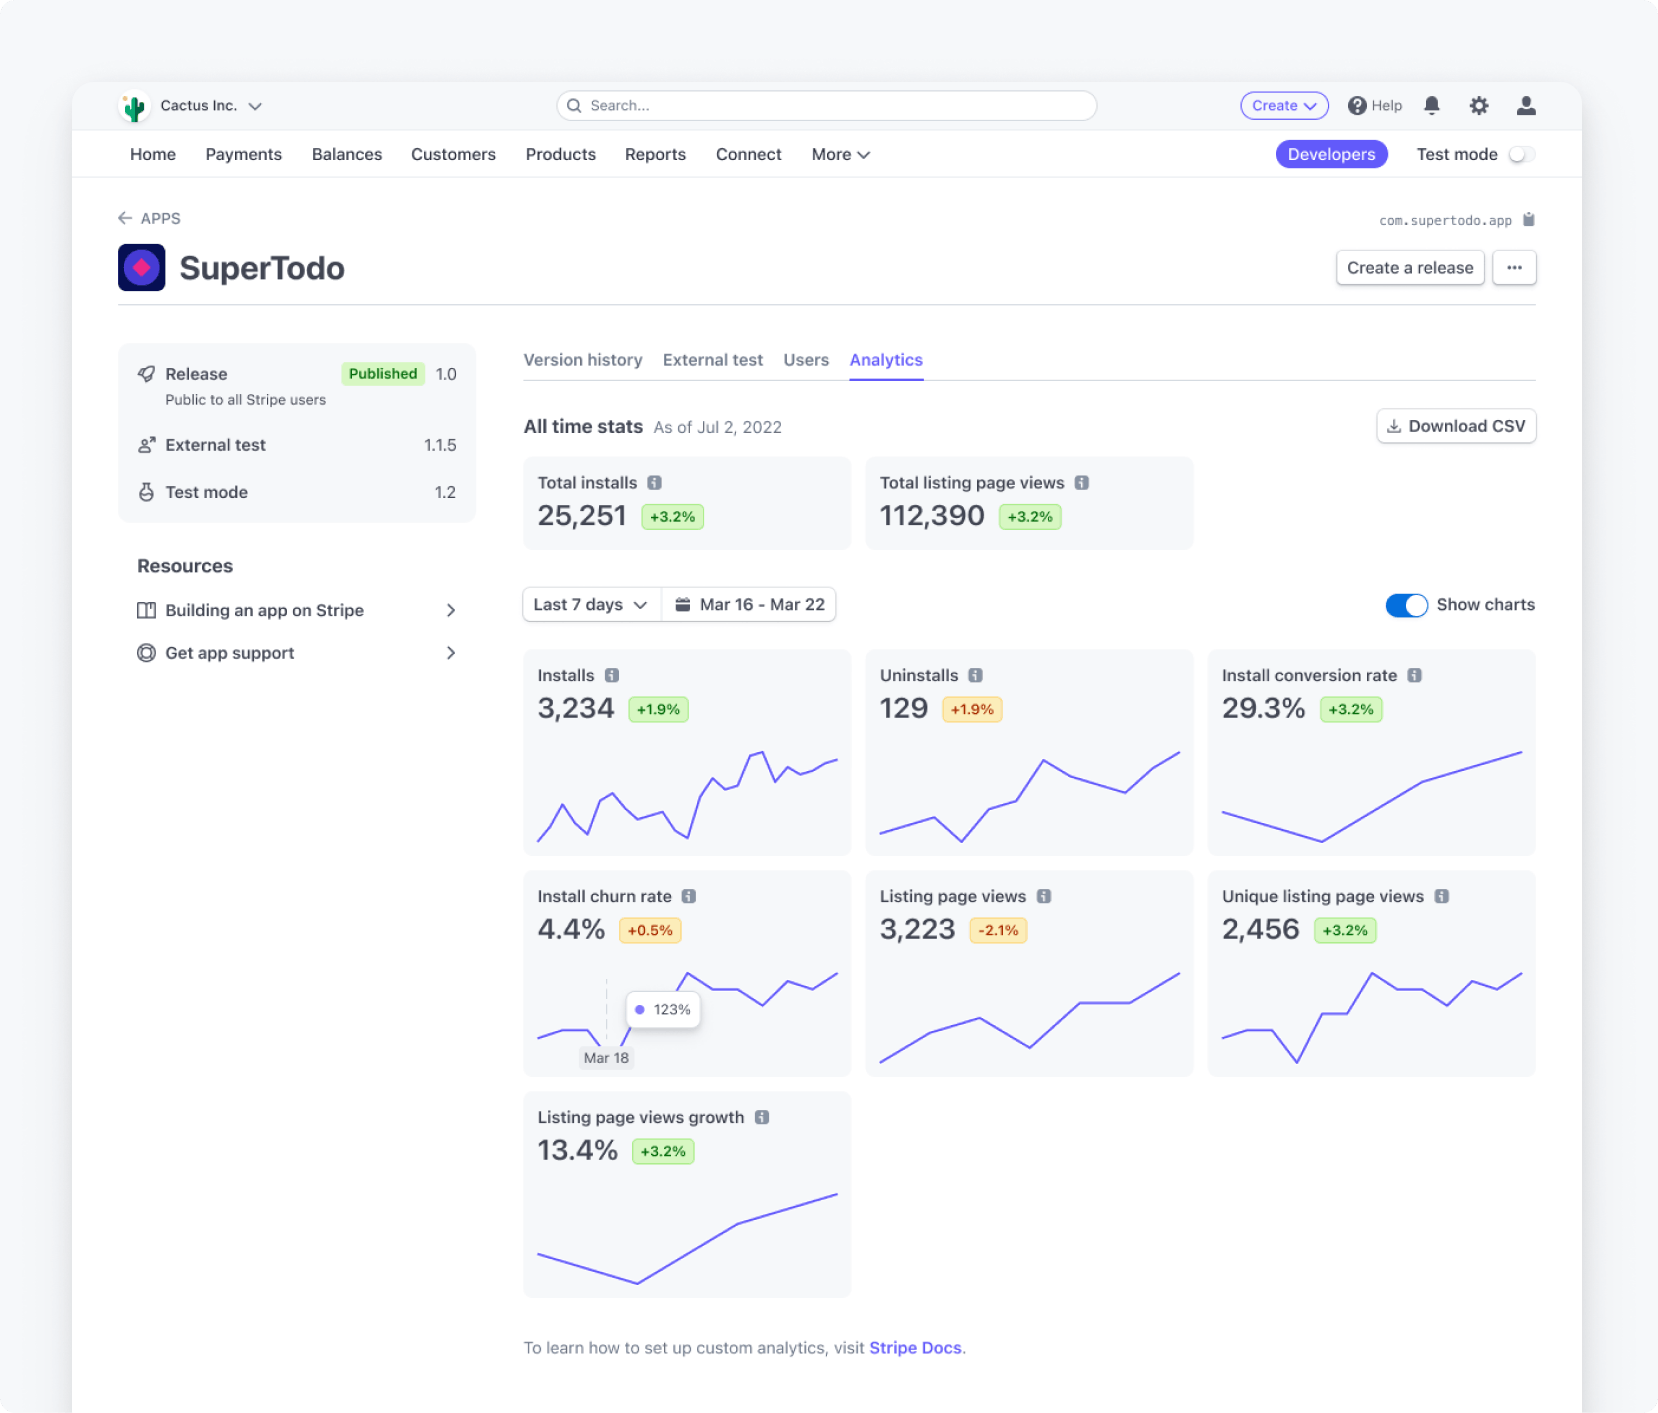
App analytics enables you to better understand how your apps are used and how your marketplace listings perform. You can export data, such as the number of installs and listing views, for your public app. This data is available in Dashboard or the Stripe API.
The Dashboard provides additional tools to help you understand your app’s performance, such as:
- Single-number summaries for the currently selected period
- Rate-based reports (%): Average for the selected period
- Non-rate-based reports: Sum for the selected period
- Badges that summarize the current period with the previous period (if sufficient historical data is available)
- Aggregation using a resolution based on your selected date range
- To download higher-resolution data, click Download CSV.

Get started
- From the Developer’s Dashboard > Apps, select your app.
- Click the Analytics tab, then click Download CSV.
- Choose the report to export and select your preferred date range.
Available reports
The following reports are available to export as a CSV.
| Name | Description | Report type |
|---|---|---|
| App installs | Installs per day | apps. |
| App uninstalls | Uninstalls per day | apps. |
| Cumulative net installs | Installs to date (installs - uninstalls) | apps. |
| Listing page views | Total daily app listing views | apps. |
| Unique listing page views | Total unique merchants who have visited your app listing page | apps. |
| MoM install conversion rate | # of new installs in the last 30 days ÷ # of leads in the last 30 days x 100 | apps. |
| MoM listing page views growth rate* | (# of leads this month - # of leads last month) ÷ # of leads last month x 100 | apps. |
| MoM install churn rate | # of uninstalls in the last 30 days ÷ # of active installs 30 days ago x 100 | apps. |
*MoM listing page views growth rate might report high values for early data points. We recommend that you consider data at least 60 days after the first non-null point.
Data freshness and definitions
The analytics data lags up to 48 hours before it’s available in reports. If you’re looking for real-time metrics, you can build your own custom analytics using our platform primitives.
We define “leads” as logged-in merchants who visit the marketplace.
Accessing using the Stripe API
To access these reports programmatically, you can use the Reporting API to run a report for the specific metrics you want to fetch. Each of the metrics is available as report types, which you can request in the following way:
Users
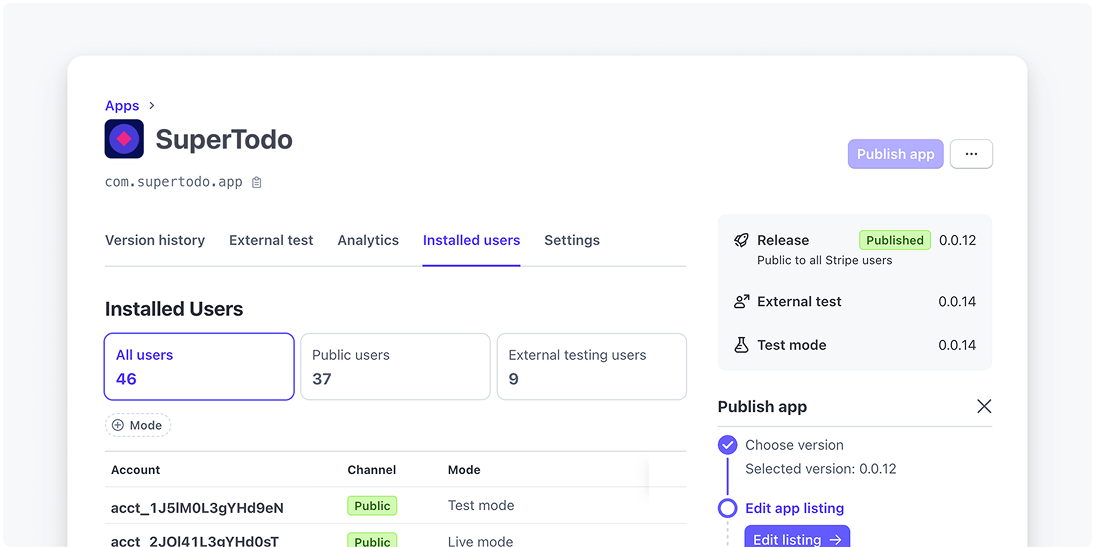
The Users tab in your app’s details page lists all the currently installed users. If a user reinstalls your app, the installed column updates to the most recent install time.

Custom analytics
If the provided metrics aren’t sufficient, you can leverage the platform primitives of Stripe to build your own set of metrics using the following solutions:
Using webhooks
Use webhooks to track and respond to users who install or uninstall your app or extension in real time, where you can get insights about:
- Installed user’s account ID
- Date and time of install
- Uninstalled user’s account ID
- Date and time of uninstall
- Stripe app users
- Extension users (if applicable)
For more information, see how to receive webhook events from your app.
Using Connect List API
Use the Connect List API to return a list of all the users who’ve currently installed your app and extension (if applicable).
For more information, see the List all connected accounts reference.