Fraud insights
Review fraud trends specific to your business so you can tailor your strategy.
Building an effective fraud fighting strategy requires understanding the specific drivers of fraud for your business. If you use Radar for Fraud Teams, you can access the Insights tab of the Radar page in your Dashboard to:
- Visualize the ratio of fraudulent and legitimate transactions across your payments.
- Identify combinations of Radar attributes that have material impact on your fraud rates.
- Adjust your Radar rules to effectively balance fraud prevention and legitimate customer conversion.
Configure your data set
You can specify the time period analyzed and what types of payment activity constitute fraud to further customize your results.
Specify the time period
By default, we display statistics in near real-time for the prior 30 days of transaction history. To see data for a different time period:
- Click the Date filter to open the time period editor.
- Use the dropdown to choose a relative comparator.
- Depending on the comparator you choose, set the parameters, such as in the last 1 months or between 2/26/2024 and 3/18/2024.
- Choose your local time zone or Greenwich Mean Time (UTC).
- Click Apply.
Configure your fraud definition
Click Configure to choose which types of transactions to include as fraudulent in your Insights statistics.
- All fraudulent transactions: Payments disputed for fraud, reported as early fraud warning (EFW), or refunded as fraud
- Only disputes: Any disputed payment, regardless of category
- Only fraudulent disputes: Disputed payments in the fraud category
- Only early fraud warnings: Issuer-flagged suspicious payment EFWs
Evaluate your fraud markers
Stripe analyzes all the payments for the specified time period, then presents:
- A summary of the total fraudulent and legitimate payments for the time period.
- A table of the top rule attribute values that suggest a correlation with fraud, based on the ratio of fraudulent to legitimate payments.
The summary and each attribute in the table provide the following statistics:
| Statistic | Description |
|---|---|
| Fraud percentage | The percentage of fraudulent payment volume where this rule attribute was present. |
| Legitimate percentage | The percentage of legitimate payment volume where this rule attribute was present. |
| Fraud volume | The total amount of the fraudulent payments where this rule attribute was present. |
| Legitimate volume | The total amount of the legitimate payments where this rule attribute was present. |
| Fraud count | The total number of fraudulent payments where this rule attribute was present. |
| Legitimate count | The total number of legitimate payments where this rule attribute was present. |
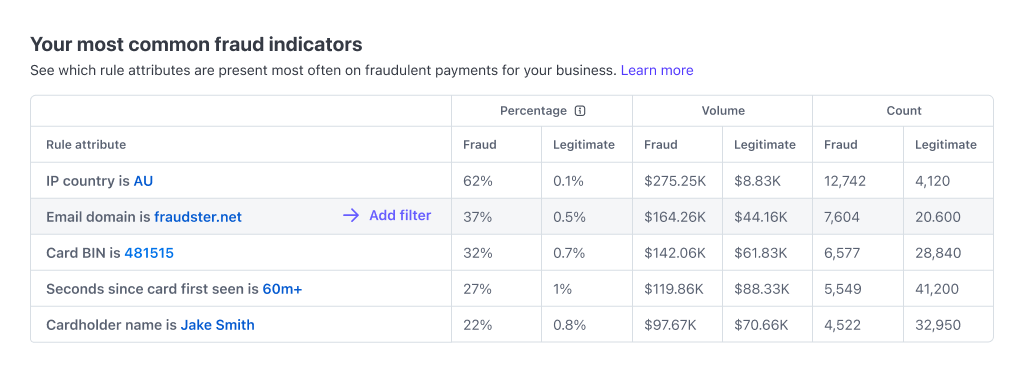
Personalized fraud indicator results
Use filters to discover high-risk attribute combinations
You can add any of the attribute values presented as your top fraud indicators as a filter. Doing so adjusts the table to show a new set of top attribute values that corresponded to fraud in combination with the filtered rule attribute value. Continue applying filters in this way to find a combination of rule attribute values that block transactions with the attributes you desire.
For example, say your top indicator shows that 19% of fraudulent payment volume had Delaware as the billing state. Blocking all payments from Delaware isn’t sensible, but to further explore through filters, you might take the following steps:
- Filter on “billing state is Delaware” and identify which other rule attributes corresponded most to fraud when the billing state is Delaware. In this case, you find that 42% of fraudulent payment volume where Delaware is the billing state has a shipping state that isn’t Delaware. That’s only 8% of the total fraudulent payment volume, and blocking all payments with billing state Delaware and a different shipping state is too aggressive, so you continue.
- Add “shipping state is not Delaware” as a second filter. Applying both filters and looking at the resulting fraudulent payment volume reveals that 75% of it involves payments of greater than 500 USD. This amounts to 6% of the total fraudulent payment volume.
- Add “payment amount greater than 500 USD” as a third filter. Comparing the results of all three filters to total payment volumes shows 6% of all fraudulent payment volume, but only 0.1% of all legitimate payment volume.
- At this point, you might set up a rule to block payments of over 500 USD that have Delaware as the billing state and a different state for shipping. You can expect that rule to block 6% of fraudulent payment volume and only 0.1% of legitimate payment volume.
As the example illustrates, you can apply a series of filters to determine a set of rule attribute values that together identify a material percentage of fraudulent payment volume. When that set also reflects a low percentage of legitimate payment volume, a rule to block those values can effectively reduce fraud while having limited impact on legitimate payments.
Customize filters
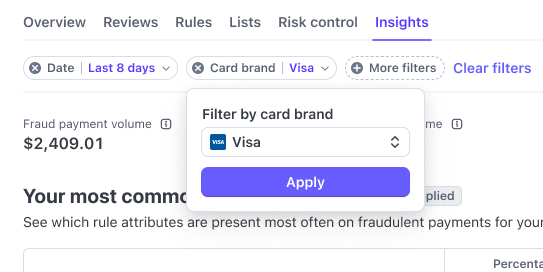
You can also create a filter without using the rule attributes presented in the table.
- Click More filters.
- Choose the rule attribute that you want to create a filter for.
- Depending on the attribute you choose, set the parameters, such as Risk score is greater than 15 or Card bin is 4242.
- Click Apply.
Create a rule
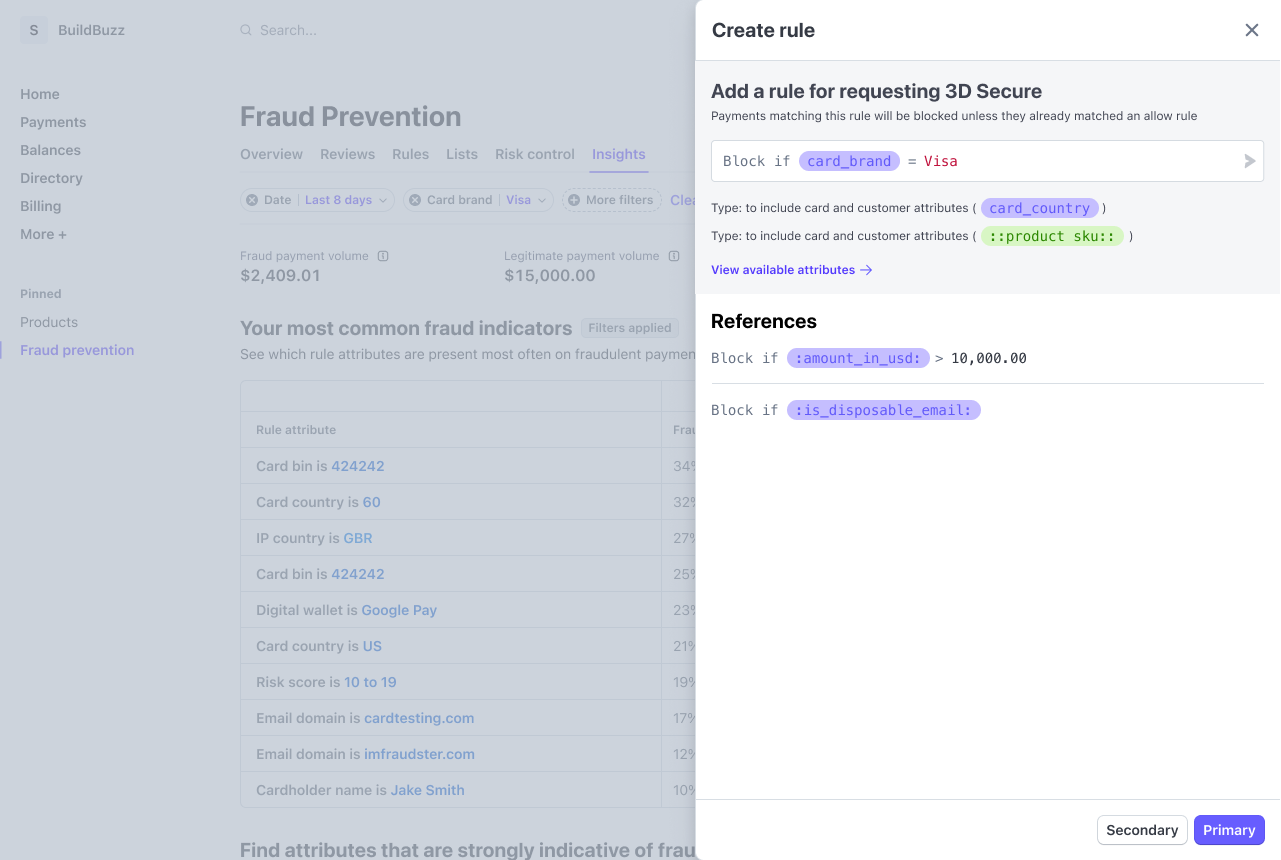
When you assemble the set of filters that represent your optimum ratio between blocking the most risky transactions without compromising legitimate payments, you can automatically create a rule to prevent payments where all the selected attributes exist simultaneously.
- Click Add block rule to slide open the rule editor.
- Check that the rule accurately reflects the attributes you filtered.
- (Optional) Augment the rule to include other attributes or your own custom metadata, such as product codes or retail locations. Try Radar Assistant to generate a rule based on your natural language prompts.
- Click Test rule.
- If necessary, correct any validation errors and retest.
- On the Review new rule page, review how this rule performs against your recent transactions to confirm whether you want to enable it.
- Click Add rule to begin applying this rule to all future transactions.
Inspect charts
You can find visualizations of the attributes identified as your top drivers of fraud below the table of your most common fraud indicators. Each chart shows the percentages of total fraudulent and legitimate payment volume associated with given values of the attribute over a specified time period.
Note
The charts represent percentages of total payment volumes, not percentages of total numbers of payments. As an example, imagine that the Billing state graph shows 6% of fraudulent payment volume for Utah. That means the total amount charged for fraudulent payments with Utah as the billing state is 6% of the total amount charged for all fraudulent payments. It doesn’t indicate that 6% of all fraudulent payment transactions had Utah as the billing state.
Hover over any point in the chart to see additional metrics for both fraudulent and legitimate payments associated with that attribute value.
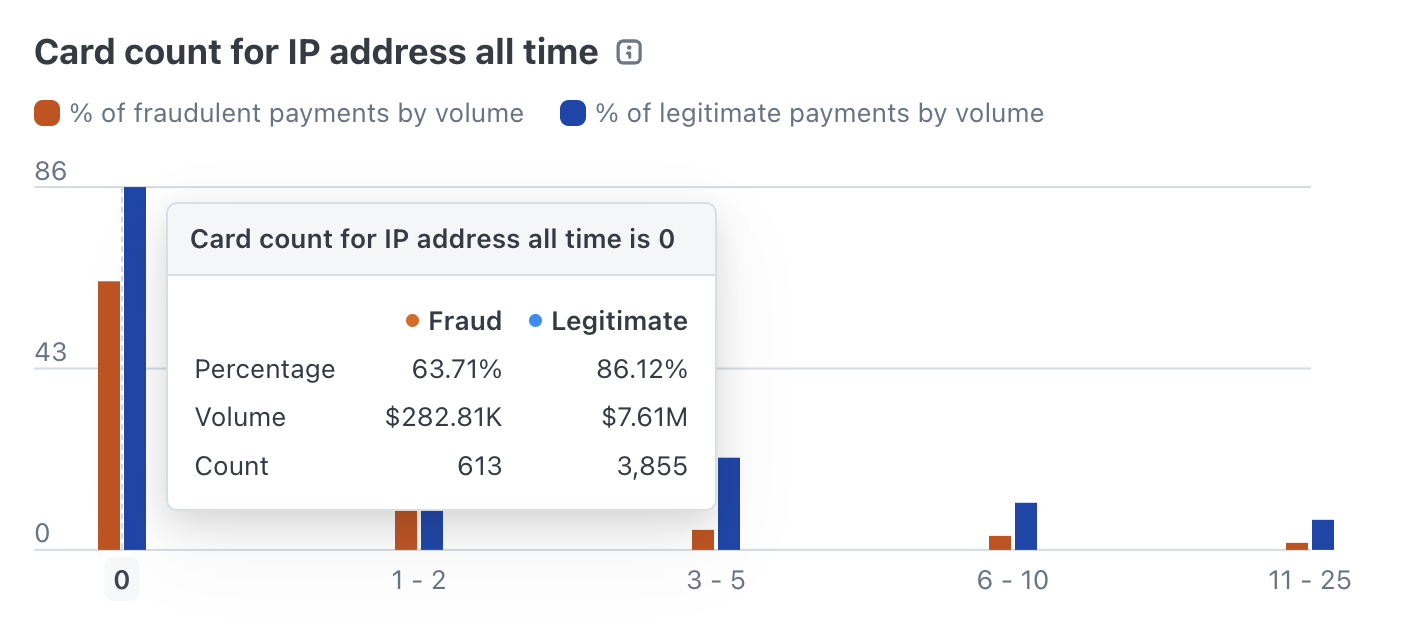
Hovering displays additional volume and count metrics.
| Metric | Description |
|---|---|
| Percentage | Percent of payments by volume at the selected point |
| Volume | Total amount charged for payments at the selected point |
| Count | Number of payments at the selected point |
Change chart attributes
The charts displayed reflect the Radar rule attributes corresponding to your top fraud drivers. To generate visualizations for other attributes:
- Click Select attributes.
- Scroll through the list or enter keywords in the search bar to find attributes.
- Click an attribute’s card to select or deselect it. Selected attributes display a checkmark and the button displays the total number of attributes selected.
- Click Show x attributes to generate the charts for your selected attributes.
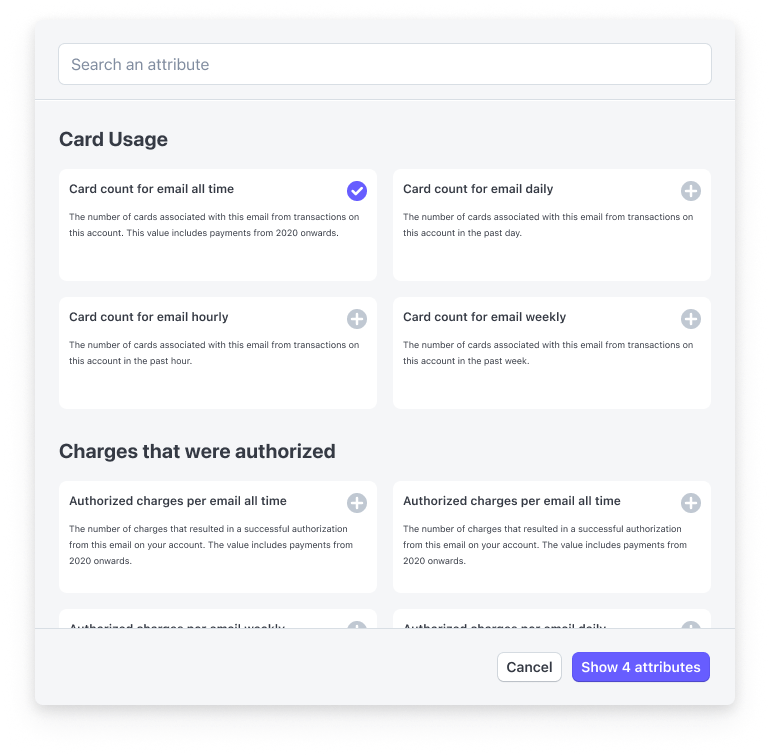
The Radar rule attribute modal allows you to choose from more than 150 attributes.