Create custom reports
Use Sigma to generate custom reports for charges, refunds, disputes, and more.
Sigma makes all your transactional data available within an interactive SQL environment in the Stripe Dashboard. It lets you create fully customised reports using information about your payments, subscriptions, customers, payouts, and so on.
With Sigma, you can:
Get information that best reflects your business and Stripe integration.
Export in CSV format to import into your tools.
Fetch data on a schedule of your choosing.
Create a custom report
Reports give you the data required for your accounting and reconciliation workflows. To create a report, query the assistant or write your own report with SQL. The reports you generate can differ from those you generate on the Stripe Dashboard in the following ways:
Data availability: For financial reports, you can find the most recent day of available data by selecting month to date or opening the date picker calendar. In Sigma, the
data_parameter provides the timestamp that data is available through.load_ time Time zone: Financial reports in the Stripe Dashboard filter reports by the local time zone by default, but you can switch them to use the UTC time zone. Sigma filters templates by the UTC time zone.
Date range: A selected date range for Stripe Dashboard financial reports, such as Jan. 13 to Jan. 14, filters reports from January 13 00:00:00 up to January 14 23:59:59. A chosen date range filter for Sigma templates for January 13 to January 14 filters reports from Jan 13 00:00:00 up to January 13 23:59:59.
Currency: Financial reports in the Stripe Dashboard always filter data to a single currency. By default, the Sigma report templates return all currencies. You can add a
WHEREclause to your Sigma query to restrict your results to a single currency.Metadata: Financial reports allow you to include metadata. Sigma templates don’t include it. You can add metadata to your reports by following the
Metadata to columnSigma template.
Reports follow the same availability rules as the Stripe Dashboard. Payout Reconciliation reports are only available for users with the Automatic payouts setting enabled, and connect variants of reports are only available for users on Stripe Connect.
Report templates
You can also create a report using a template. By default, these reports run on the last completed month that all data is available for. To change the dates, make a copy of the template and edit the report date intervals. Use the listed templates to generate their related reports and their connected variants:
| Report group | Sigma template name | API report type |
|---|---|---|
| Balance report | Itemized balance change from activity | balance_ |
| Itemized payouts | payouts. | |
| Payout reconciliation report | Itemized payout reconciliation | payout_ |
| Itemized ending balance reconciliation | ending_ |
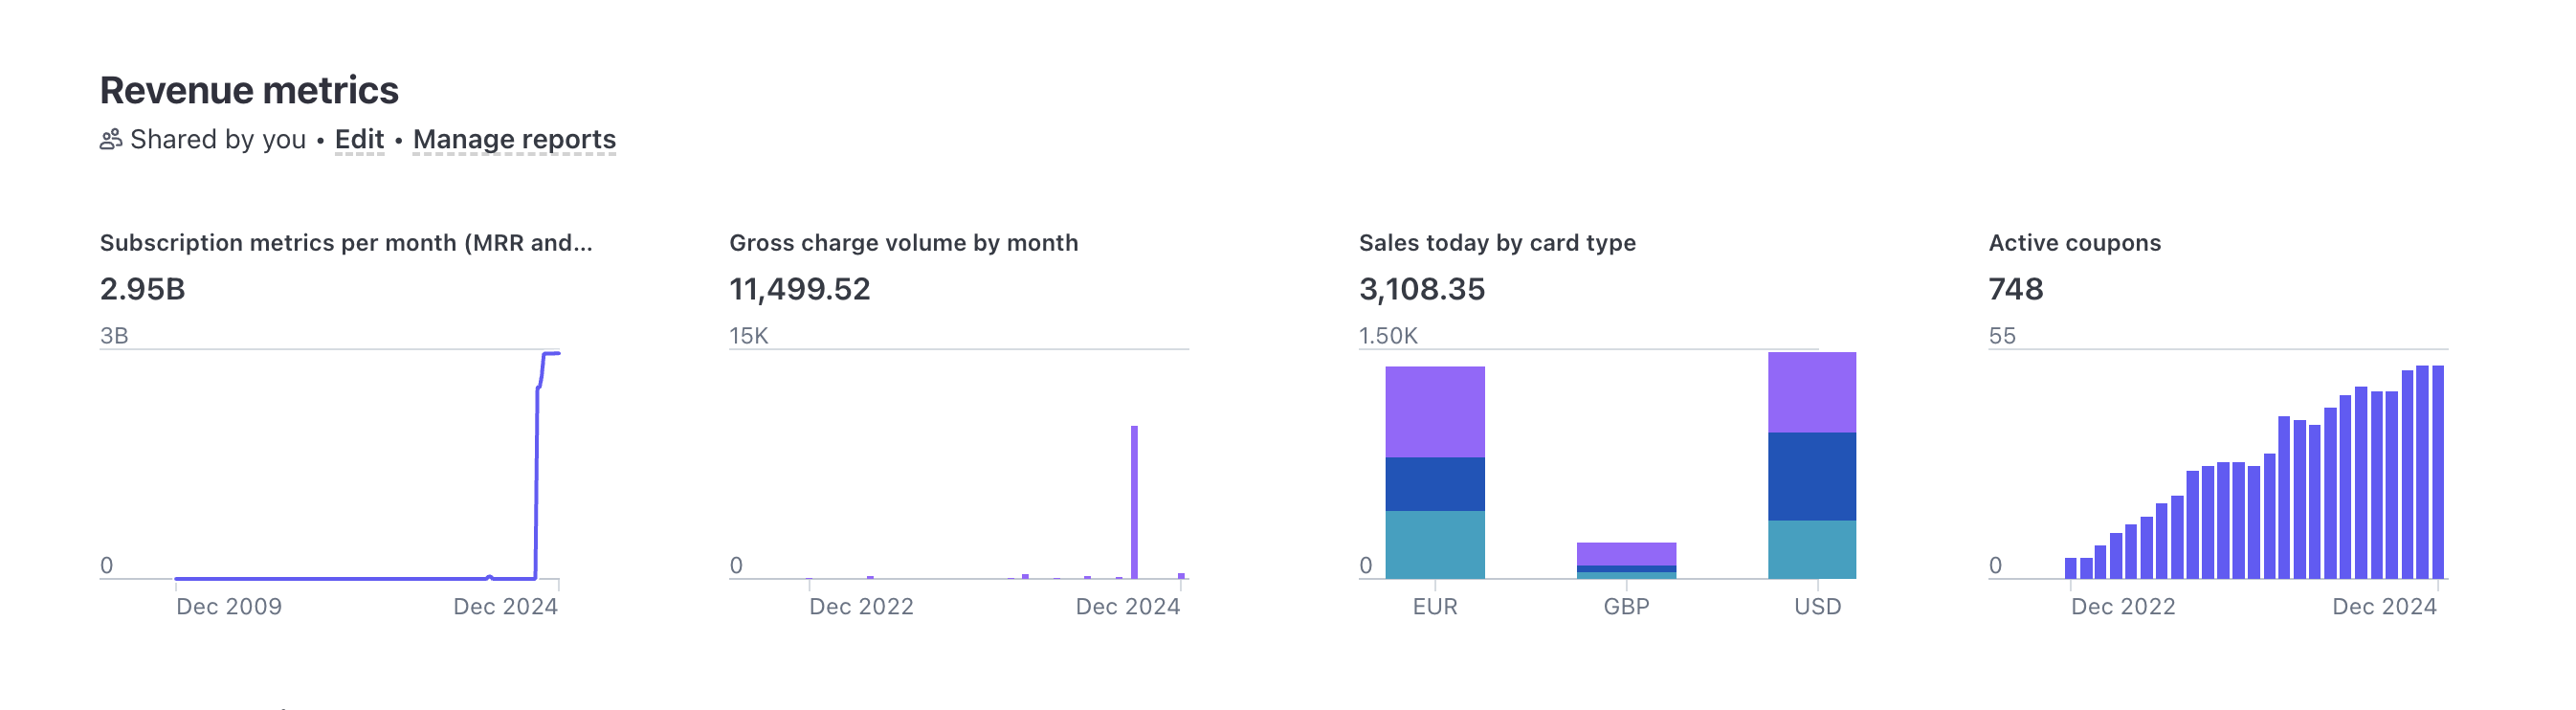
Create and manage metrics
Create metrics from your Sigma reports and organise them in metric groups to monitor your most important metrics daily. Edit the Sigma chart on your metric to customise the metric preview. Metric groups that don’t have a chart enabled display the number of rows in the report.
You can add up to 20 Sigma reports across all metric groups. Only the author of the metric group can edit or delete the metric group. If you delete a metric group, it doesn’t affect the reports in that group.
Unsubscribing from Sigma
If you currently have an active Sigma subscription and want to cancel it, go to your Sigma settings and click Cancel Stripe Sigma subscription. You can continue using Sigma until the end of the billing cycle, at which point the subscription ends.