# Chart layout for Stripe Apps
Choose the right chart for your data and control chart sizing and arrangement within your app.
Charts visualize trends, comparisons, and distributions in your app. They help users understand data at a glance without reading raw numbers.
## Before you begin
Before you implement chart layout patterns, make sure your app meets these requirements:
- [Create an app](https://docs.stripe.com/stripe-apps/create-app.md) or use an existing one.
- Install `@stripe/ui-extension-sdk` version `9.2.0` or later.
- Import chart components from `@stripe/ui-extension-sdk/ui/next`.
- Review the next-generation chart component references: [LineChart](https://docs.stripe.com/stripe-apps/components/linechart.md?app-sdk-version=9Next#linechart-next-props), [BarChart](https://docs.stripe.com/stripe-apps/components/barchart.md?app-sdk-version=9Next#barchart-next-props), [MeterChart](https://docs.stripe.com/stripe-apps/components/meterchart.md), and [SparkLineChart](https://docs.stripe.com/stripe-apps/components/sparkline.md).
> Chart components are available from two import paths. Import from `@stripe/ui-extension-sdk/ui/next` for next-generation chart components with the data-driven API. The components at `@stripe/ui-extension-sdk/ui` use an older API that doesn’t support forecasting, comparison periods, or automatic variant rendering.
## Apply best practices
Keep these principles in mind when you build chart layouts:
- **Choose charts that match your data story**: Line charts show trends, bar charts compare totals, meter charts show proportions, and sparklines show compact trends.
- **Constrain height explicitly**: Wrap every chart (except `MeterChart`) in a fixed-height container to prevent layout shift and maintain visual consistency.
- **Keep related charts at the same height**: When charts appear in the same row or section, use the same height value so they align visually.
- **Pair charts with headline metrics**: Show the current value above the chart so users get the answer before checking the trend.
## Choose the right chart
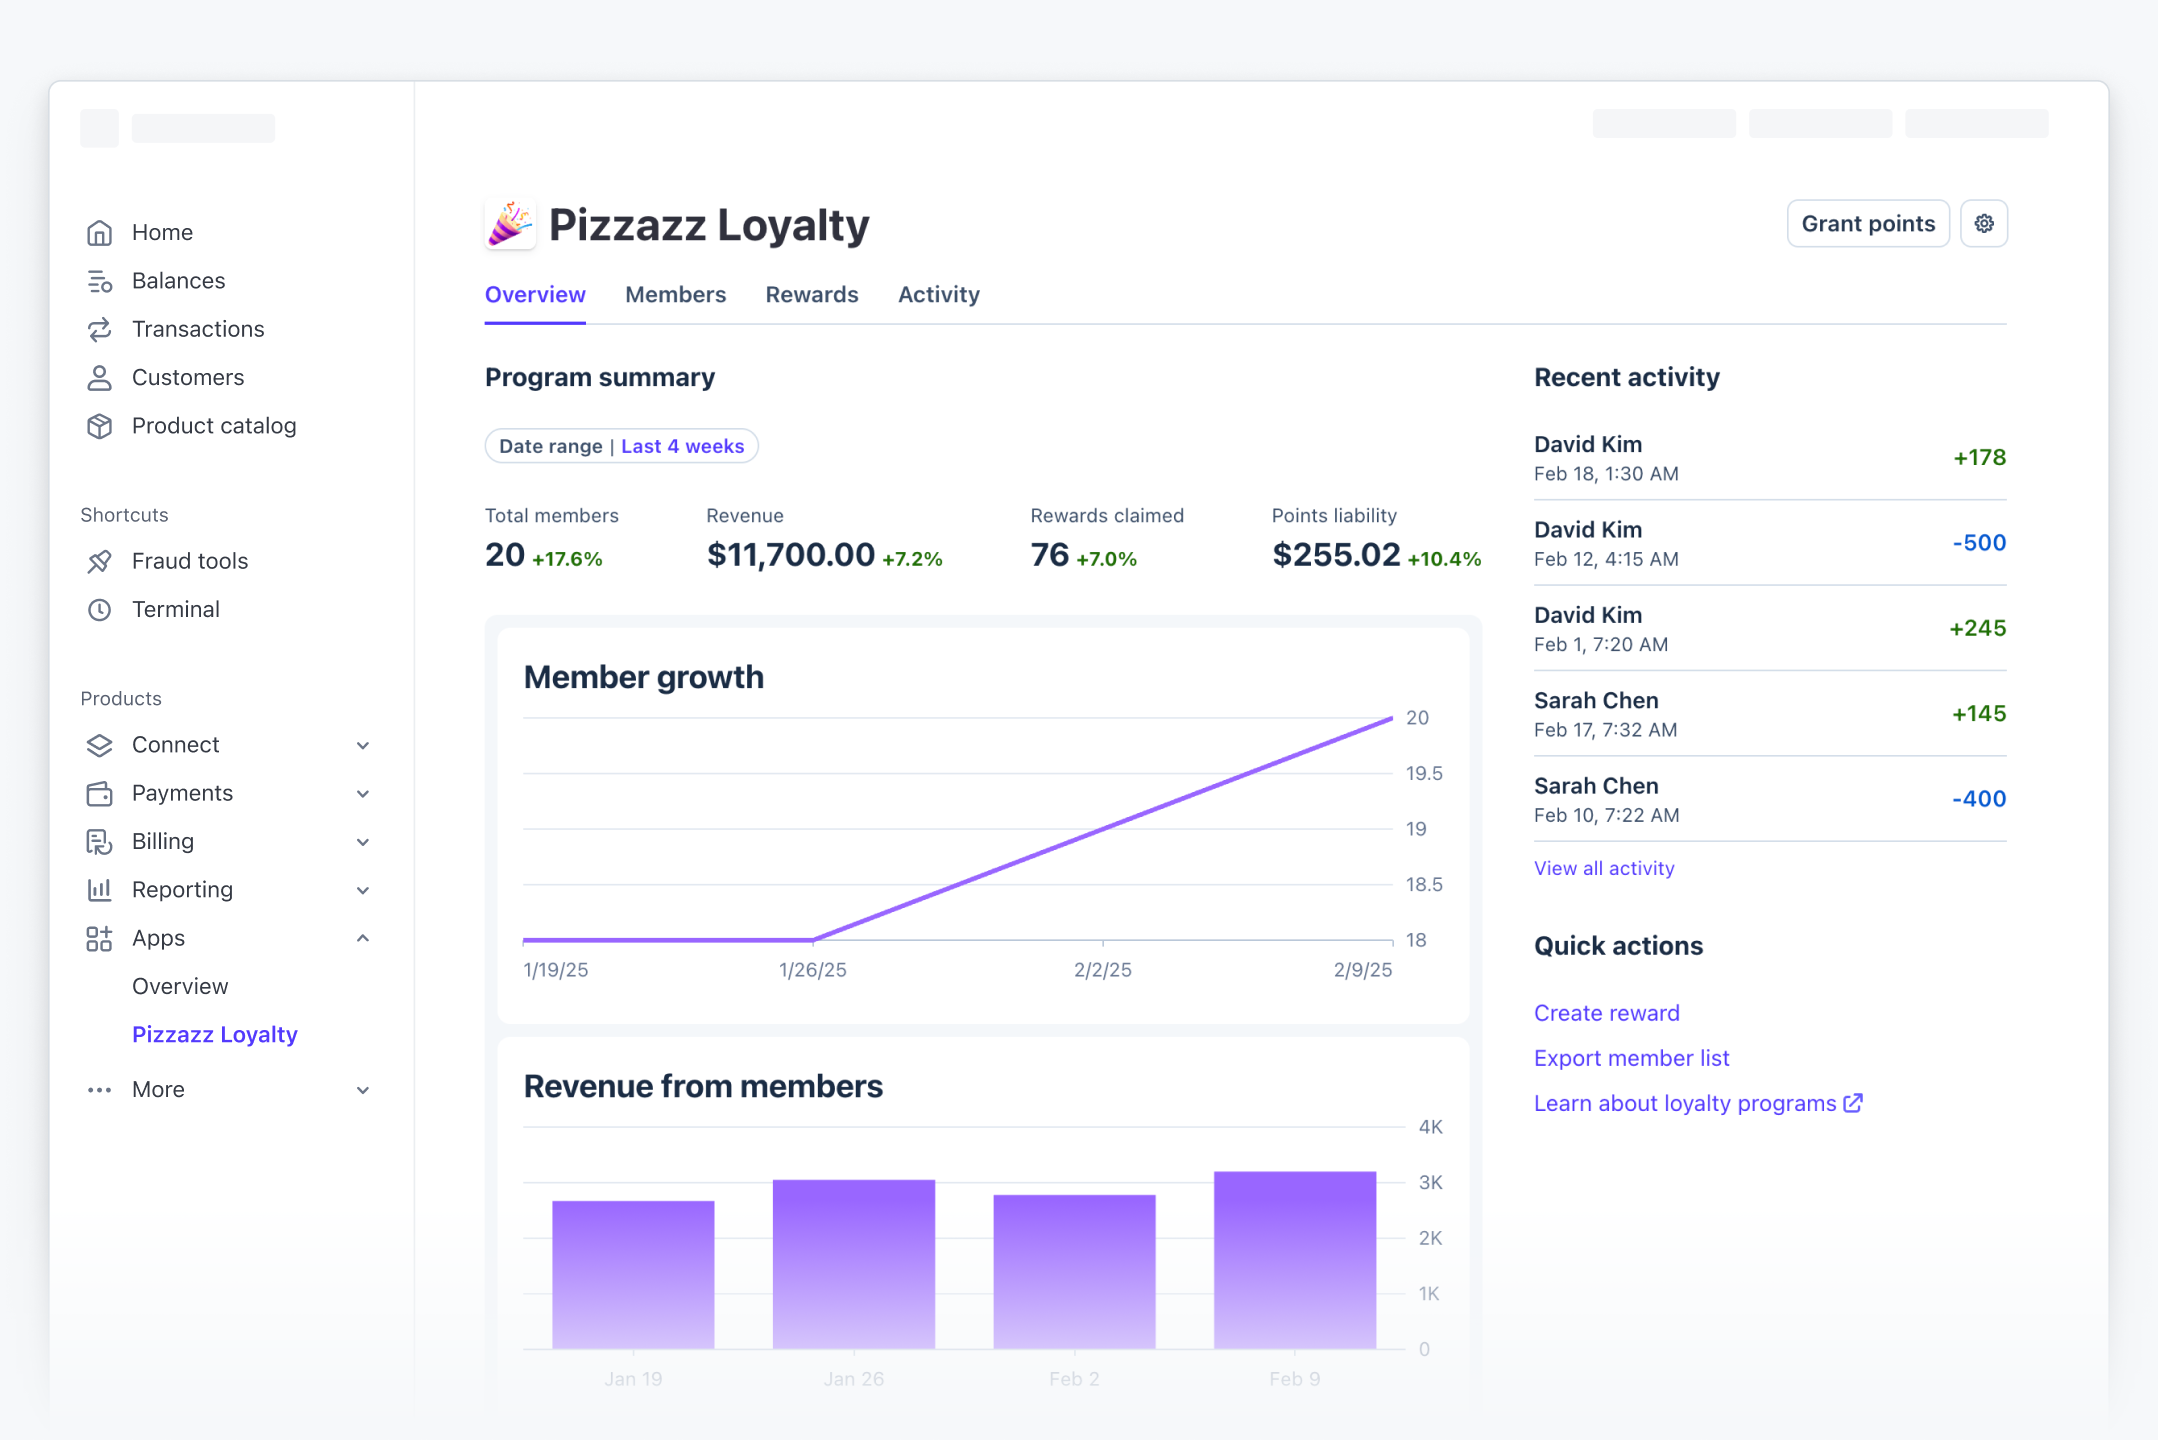
The right chart depends on the question your users are trying to answer, not the data format.
| User’s question | Chart | How it works | Watch out for |
| --- | --- | --- | --- |
| “Is this going up or down?” | [LineChart](https://docs.stripe.com/stripe-apps/components/linechart.md) | Connects data points to show direction and rate of change. Zooms the y-axis to make small variations visible. | Don’t use when absolute totals matter more than the trend. Line charts de-emphasize volume. |
| “How much is each category?” | [BarChart](https://docs.stripe.com/stripe-apps/components/barchart.md) | Displays discrete totals as bars starting from zero. Makes it straightforward to compare amounts across categories or time periods. | Small differences in large values become invisible because bars must start at zero. Use a line chart if a 100 USD change in 11,000 USD matters. |
| “What’s the breakdown of this total?” | [MeterChart](https://docs.stripe.com/stripe-apps/components/meterchart.md) | Shows proportions as segments of a single horizontal bar. Compact enough for sidebars and secondary columns. | Only shows a single snapshot. If you need to show how proportions change over time, use a stacked `BarChart` instead. |
| “What’s the quick trend?” | [SparkLineChart](https://docs.stripe.com/stripe-apps/components/sparkline.md) | A compact line with no axes or labels. Sits inline next to a KPI value to give directional context at a glance. | Don’t use when users need to read precise values. Sparklines show shape, not numbers. |
## Constrain chart height
Chart components expand to fill their container. To control their size, wrap each chart in a [Box](https://docs.stripe.com/stripe-apps/components/box.md) with a fixed pixel height.
```jsx
import {Box} from '@stripe/ui-extension-sdk/ui';
import {LineChart} from '@stripe/ui-extension-sdk/ui/next';
```
The container owns the height, and the chart fills it. This prevents layout shift when data arrives.
### Recommended heights
Use these heights as starting points based on context:
| Context | Height | Rationale |
| --- | --- | --- |
| Chart inside a `PageModule` within the `OverviewPage` component | `180` | Matches the chart area in standard Dashboard metric cards. Compact enough to show multiple charts without scrolling. |
| Featured chart on a detail page or full-width layout | `320` | Provides room for more data points and axis labels. Matches the detail view pattern used in Dashboard analytics pages. |
| `SparkLineChart` inline with a KPI | No height needed | `SparkLineChart` sizes itself based on the surrounding text or container. |
```jsx
// Compact chart within the `OverviewPage` component
// Featured chart with more room
```
> Don’t set the height on the chart component itself. Chart components don’t accept a `height` prop in Stripe Apps. Always wrap them in a `Box` with a fixed height.
### MeterChart sizing
The `MeterChart` renders as a fixed-height horizontal bar with an optional legend below it. It sizes itself intrinsically and doesn’t require a height wrapper.
```jsx
// No height wrapper needed
```
## Arrange charts in a row
Place two or three charts side by side using a horizontal stack with fractional widths inside a single `PageModule`. This creates a chart lockup for comparing related metrics at a glance.
```jsx
// Charts in a row within the `OverviewPage` component
Revenue
Subscribers
```
> Don’t wrap `PageModule` inside a `Box` or other layout container. `PageModule` must be a direct child of `OverviewPage` or `DetailPage`. Place the horizontal stack layout inside the `PageModule`, and use caption-styled labels to identify each chart.
### Fractional width tokens
Use fractional widths to divide the row. Unlike percentages, fractional tokens account for the gap between items.
| Charts per row | Width per chart | When to use |
| --- | --- | --- |
| 2 | `1/2` | Two related metrics of equal importance. |
| 3 | `1/3` | A Dashboard overview with multiple metrics at a glance. |
| 1 large + 1 small | `2/3` + `1/3` | A primary chart paired with a secondary breakdown or meter. |
```jsx
// Asymmetric layout within the `OverviewPage` component
Growth
Distribution
```
> Don’t place more than three charts in a single row. Charts become difficult to read when compressed below roughly 200px wide. Use `PageModule` within the `OverviewPage` or `DetailPage` components to organize multiple charts.
## Give charts a background
To draw focus to specific charts, add a background. Group them inside a `Box` with `backgroundColor: "container"` for a layered effect.
```jsx
```
## Pair charts with summary metrics
Show the current value prominently above the chart so users get the answer immediately, then use the chart to show how that value changed over time.
### Add a sparkline next to a KPI
Use `SparkLineChart` to show a compact trend inline with a metric value. This gives directional context without taking up space for a full chart.
```jsx
Total members
261
Revenue
$33,200
```
### Add a full chart below metrics
For more detailed trends, place a full-height chart below the headline metrics.
```jsx
Total revenue
$33,200
Growth
+12%
```
This follows the pattern used on the Stripe Dashboard home page. A header with the current value sits above a chart showing the trend.
### Place charts in a full-page app with OverviewPage
The [OverviewPage](https://docs.stripe.com/stripe-apps/components/overviewpage.md) component is available in [full-page apps](https://docs.stripe.com/stripe-apps/patterns/full-page-apps.md) that use the `stripe.dashboard.fullpage` viewport. Use `OverviewPage` to organize multiple metric-chart pairs into primary and secondary columns.
```jsx
import {Box, OverviewPage, PageModule} from '@stripe/ui-extension-sdk/ui';
import {LineChart, BarChart, MeterChart} from '@stripe/ui-extension-sdk/ui/next';
}
secondaryColumn={
<>
}
/>
```
## Differentiate chart states
A chart container can be in one of four states: loading, error, empty, or populated. Render them in priority order so users always see the appropriate feedback.
```jsx
if (isLoading) {
return (
);
}
if (error) {
return ;
}
if (data.length === 0) {
return ;
}
return (
);
```
> Use the same `height` value for loading, error, empty, and populated states. If your chart container is 180px tall when showing data, your loading spinner also sits inside a 180px container. This prevents content below the chart from jumping when data arrives.
## See also
- [Next-generation chart components](https://docs.stripe.com/stripe-apps/next-ui-components.md)
- [Loading pattern](https://docs.stripe.com/stripe-apps/patterns/loading.md)
- [Empty state pattern](https://docs.stripe.com/stripe-apps/patterns/empty-state.md)