Revenue reportingPrivate preview
Learn how to automate your business performance metrics and financial reporting.
Stripe Revenue Reporting provides automated, interactive revenue metrics and reports to help you understand your business performance and your month-end close from the Stripe Dashboard. It includes:
- Key revenue and growth metrics, such as revenue by product, customer, growth, and MRR
- Interactive analysis and drill-down tools to help you investigate trends and anomalies in your data
- Reliable and precise data with transparent methodology and auditing
- Accountant-ready financial statements that match your business metrics
Note
Revenue Reporting isn’t a substitute for professional services or professional advice. You’re responsible for any data you provide to us.
Performance insight charts
View the following charts to gain insight on your business performance.
| Category | Chart name | Description |
|---|---|---|
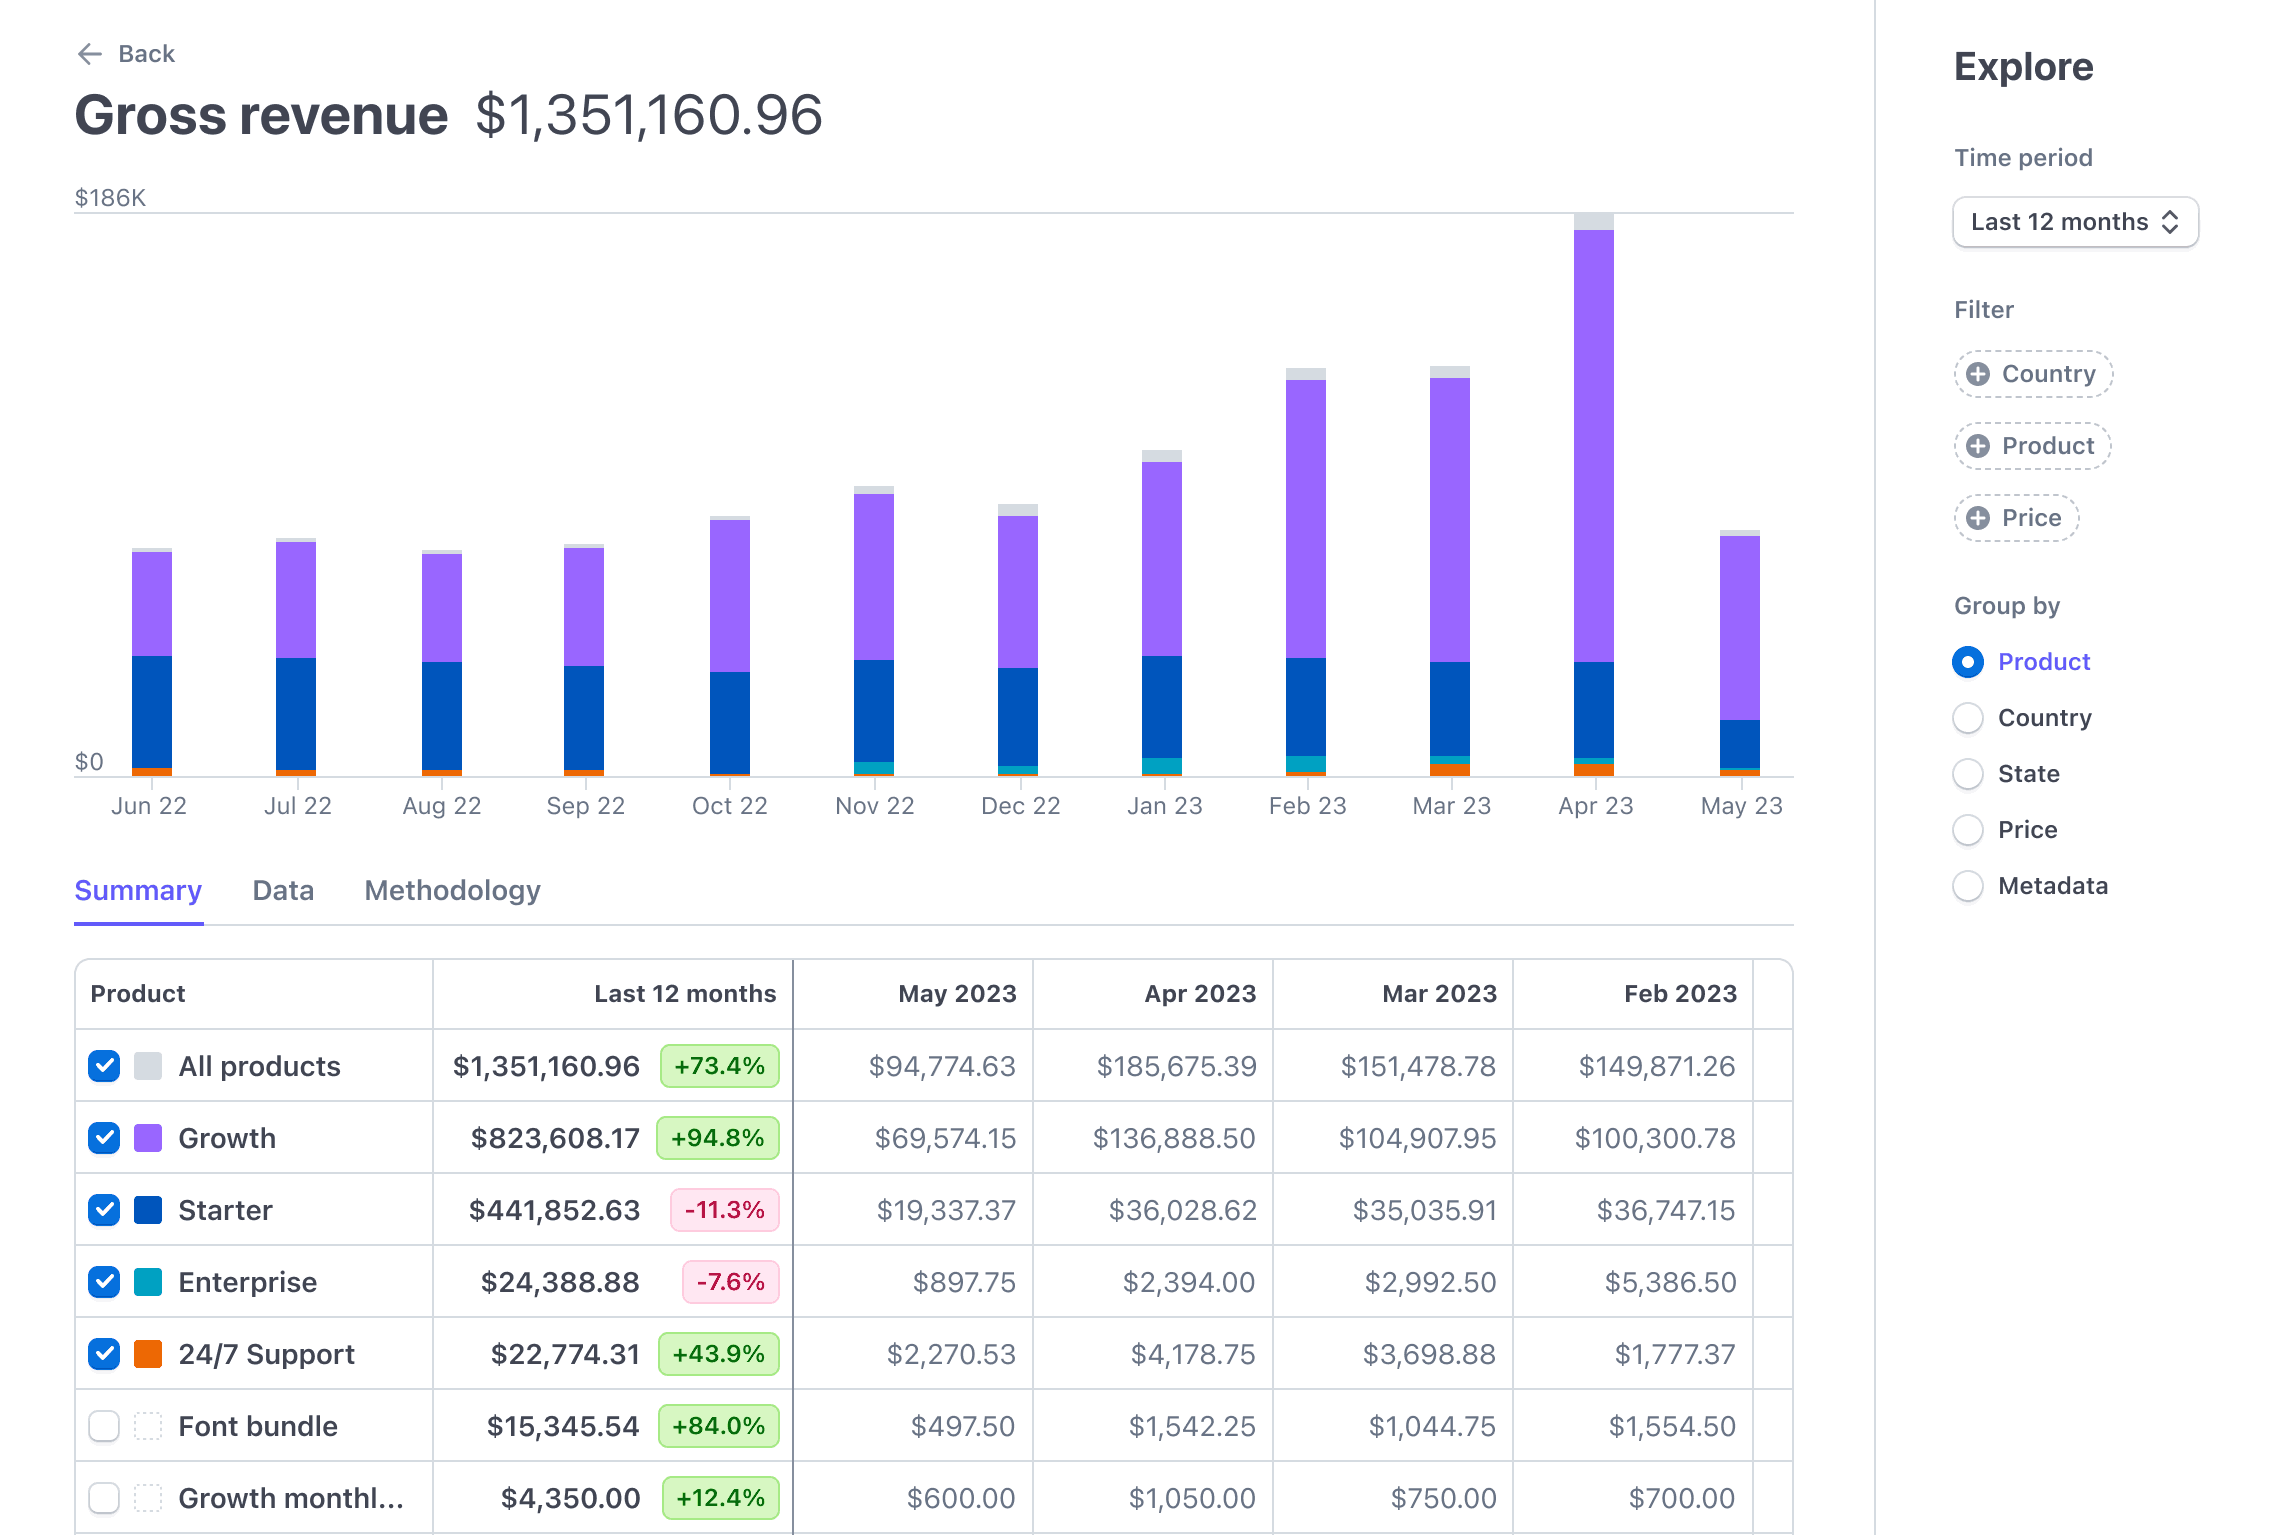
| Revenue | Gross revenue | The total revenue processed. View an accurate breakdown of how your business performed across products, geographies, prices or plans, and metadata. |
| Revenue | Net revenue | The total revenue after contra revenue. This includes fees, disputes, and refunds. All types of Stripe fees are included: network fees, additional Stripe fees, fees returned from refunds, fees from disputes, and fees from dispute reversals refunds. |
| Recurring revenue | MRR | Your monthly recurring revenue for monthly, quarterly, and annual subscriptions. View how much revenue you’re making on a recurring basis. |
| Recurring revenue | MRR Change | The monthly change in your MRR and the different types of user activity that this change is attributed to. We categorise activity based on the customers’ total monthly MRR changes and subscription activity. |
| Recurring revenue | Churned revenue | Revenue lost due to customer cancellations, failed payments, and downgrades for each month. We count churn at the moment of cancellation by default. This differs from churn values in the MRR change chart because we count any reduction in revenue (for example, contractions) as part of churned revenue. |
| Revenue | Unpaid invoices | The rate at which you collect revenue owed to your business. View the duration of the invoices due for each month, ranging from currently due to 120+ days overdue. |
| Customers | Active customers | Changes in your customer count between subscription and non-subscription customers, active and inactive, as well as paying and non-paying customers. |
| Customers | Subscriptions customers | Changes to your customers’ subscriptions and activity. Excludes guests but includes deleted customers. |
| Customers | Subscription customer churn | Instances when your customers’ MRR dropped to 0 during a month. The date of churn is when the customer cancels the subscription. This doesn’t account for the time that remains on their subscription. If a customer churned off one subscription but signed up for another, they won’t be counted in this list because it’s considered expansion or contraction based on the net change in their MRR. |
Segment and filter charts
Define segments and filters to refine your data.
Metrics details page
Select one of the following categories under Group by to segment metrics:
- Product
- Price
- Country
- State
- Metadata on a customer, subscription, product, charge, invoice, and invoice item
You can’t use Group by for charts that contain a default segmentation (for example, net revenue is grouped by fees, refunds, and disputes). Instead, click one of the categories under Filter to generate specific segments in these charts.
Click Group by product to view gross revenue data, then filter by Country to view how much revenue is generated for each product by the country or countries you selected.
Use the following tabs to further refine your data:
- Summary: The cumulative revenue or count for the time period you select.
- Data: Shows individual transactions that make up the summary. Download this data to CSV to conduct audits for a high volume of transactions.
- Methodology: Shows how we calculate the numbers that you see in the charts.
Download CSV reports
Download reports as CSV files with any configuration:
- Next to the report, click Download.
- If applicable, select the report format.
- Choose the columns you want to include in the report.
- Click Download.
Accounting reports
View summaries of your monthly incoming statements, balance sheet entries, and monthly debit-credit journal entries for accounts with activity.
| Report | Description |
|---|---|
| Income statement | This report summarises monthly income statements, and you can filter by product, price, customer, invoice, invoice line item, or metadata. |
| Balance sheet | This report includes monthly balance sheet entries, and you can filter by product, price, customer, invoice, invoice line item, or metadata. |
| Debits and credits | This report includes monthly debit-credit journal entries for accounts with activity, and you can filter by product, price, customer, invoice, invoice line item, or metadata. |